The FleX-ray CT-scanner located at the CWI, is a flexible system that can scan a large range of different objects. For a CT scan, X-rays are shot through an object, which blocks part of the radiation. A detector measures the radiation coming through, thus creating a ‘shadow’ image that is based on the density of the object. For a CT scan, the object is rotated to take images of all sides and these images are then combined using reconstruction algorithms into a 3D image of the interior of the object. The experimental FleX-ray scanner is used to develop new methods and explore new ideas in many research areas ranging from food quality testing to answering art historical questions.
An important aspect of generating new research is exploration. We often have visitors in the lab, who hope to answer their research questions using CT scans. Because of the wide range of possible objects to scan and investigate, the results are often unknown beforehand. Therefore, explorative scans are performed to find out what information they can offer. Sometimes these lead to new research projects and sometimes the conclusion is that CT scanning does not directly add to other research methods. The exploration process in itself is interesting and exciting, we present behind-the-scenes stories in this blog series.


Francien Bossema - PhD student in computational imaging at CWI and Rijksmuseum and Rosa de Boer - PhD student in paleomagnetism at Utrecht University
The floor is lava!
In the summer of 2021, earth scientist Rosa de Boer went on an expedition to the volcano Etna on Sicily to collect rock specimens for her research. The Etna is an active volcano that has grown tens of meters in the past year alone, due to its frequent eruptions.
Typically, rock samples are collected using large drills which involves a lot of noise, a lot of mud and a lot of sweat. During Rosa’s expedition, the Etna was nice enough to contribute loud rumbling sounds and ash rains to the experience, as it was erupting in the background. Rosa is a PhD student at Utrecht University, investigating micromagnetic tomography for rock-magnetism. She looks at individual magnetic particles in rocks to determine what the Earth’s magnetic field looked like throughout the history of Earth.
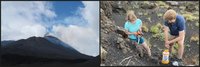
Left: The Etna releasing smoke and ash, before an eruption. Right: Rosa drilling samples from volcanic rocks on the Etna.
How to unravel the Earth’s magnetic field
Magnetite (Fe₃O₄) is the most magnetic mineral on Earth and is commonly found in volcanic rocks, such as the lavas (rocks formed by solidified lava flows) of the Etna. Because of its magnetic properties, magnetite can hold and preserve information on the magnetic field that was present during its formation. The Earth has a magnetic field that you can observe when looking at a compass, but this field changes both direction and intensity throughout time. For example, every few hundred thousand years it reverses, which means that North becomes South and South becomes North on your compass. These changes in the magnetic field can be recorded when grains of magnetite are formed in volcanic rocks.
For her research, Rosa collects volcanic rock samples and looks at these magnetite grains with a magnetic microscope that can determine the magnetization of the grains. She combines this data with volumetric and spatial data of the grains to model the paleomagnetic field of the Earth. The size, shape and location of the magnetite is essential to the way it preserves the magnetic field internally, but is hard to determine when looking at the outer surface of a rock. Therefore, CT scans are needed to visualize the interior of the rocks.
Scanning a rock sample from the Etna
To investigate the use of the Flex-ray scanner for Rosa’s research, she visited Francien Bossema at the Flex-ray lab with a sample she took on the Etna. The single magnetite grains, which are the subject of interest, are only a few micrometers to a few millimeters in size. Therefore, the challenge is scanning the sample to get the highest possible image resolution with the Flex-ray machine. The resolution is limited by the size of the detector pixels and the size of the beam and can be adjusted by moving the source, object on the rotation stage and detector relative to each other. After some trial and error, we managed to scan the sample with a resolution of 15 micron (0.015 mm).
A slice through the 3D reconstruction is shown in the image below. The different minerals in the rock are clear in this image: lighter/brighter spots indicate parts with high density, the darker spots indicate lower density minerals. The black color indicates air and pores in the rock, which is typical for lavas. Magnetite can be easily recognized as the tiny bright spots, because it has a relatively high density of 5.15 g/cm³. From this reconstruction the size, shape and location of the magnetite can be determined and used for the inverse modelling of the magnetization of the grains.
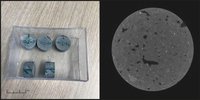
Left: Samples collected from the Etna flow of 2002. Right: A slice through the 3D construction of the Etna sample. The bright spots indicate magnetite grains, the black spots indicate pores and the different shades of grey indicate other typical lava minerals such as pyroxene (XY(Si,Al)₂O₆) and olivine ((Mg,Fe)₂SiO₄).
Tomographic challenges
In addition to finding out whether CT scanning can lead to new insights for paleomagnetic research, we are interested in testing the limits of the FleX-ray scanner. To this end, Rosa brought two more rocks with her: a dense rock that mainly consists of iron and a porous volcanic rock with large density contrasts between the pores and the minerals.
Iron and other metals are a challenge for CT scanning, as they block most of the X-rays. This is the reason that many CT facilities have lead in their walls, which protects the people working with radiation because it prevents the X-rays from travelling outside the scanning room. The iron-rich rock also shows this effect very clearly: on the radiograph no contrast is visible and the rock shows up entirely black. This means (almost) no X-rays are coming through and the reconstructed image will not give any information on the internal features of the object.
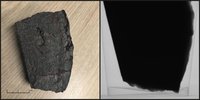
Left: Sample from a banded iron formation from South Africa, formed approximately 2.36 billion years ago. Right: The radiograph of the samples shows no internal features at all, because the high amount of iron in the sample prevents the X-rays from reaching the detector.
These results stand in great contrast to the images produced from the scan of the porous rock. The porous rock is very lightweight, its density is so low that it floats on water. From the outside it has a sponge-like appearance. In the radiographs it is clearly visible that there is contrast between the pore space and rock and the shape and size of these pores are nicely shown on the reconstruction. The different shades of grey indicate the presence of various minerals, but no bright spots can be seen. This is probably caused by the size of the magnetite in this rock, it is likely that the maximum size of magnetite is only a few micrometers which cannot be detected by the current scanner. Going to scanners with even higher resolution, such as MicroCT or nanoCT, might be able to detect these minerals.
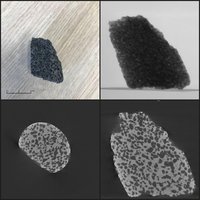
Top left: Sample from the La Reúnion flow of 2004. Top right: The radiograph shows the sponge-like structure of the sample.Bottom left: A slice through the 3D structure of the sample. Many pores are visible as well as some different minerals, indicated by slightly different colors of grey. Bottom right: Reconstruction of the sample, clearly showing the pore structure. No bright spots are visible, which means that the magnetite is too small to be detected.
The scanning of the three rock samples has given us information on the possibilities of scanning with the FleX-ray scanner and the possible use of CT for paleomagnetic research. Although the scanning of the Etna samples was very successful, nanoCT scanning might be a better solution as some magnetite grains are below the detection rate of the Flex-ray scanner. Visualizing the internal structure of the iron-rich sample is a big challenge, but could lead to fascinating new insights. An interesting example of a successful explorative scan that provides insights to both parties!
Are you interested in collaborating with our researchers and/or have a research question that could be solved using CT? Please contact us at seewhatsinside@cwi.nl!
More information
- TV episode on Rosa’s recent field work to the Etna, including beautiful views of the volcanic eruption.
- Podcast on the Earth’s magnetic field, including an interview with Rosa on her research.
- The FleX-ray scanner
- Podcast about FleX-ray scanner and art research with Francien Bossema
-
Contact details authors:
Rosa de Boer: r.a.deboer1@uu.nl
Francien Bossema: francien.bossema@cwi.nl/seewhatsinside@cwi.nl