Blogpost: behind the paper

In this blog post PhD researcher Maximilian Kiss shares the personal journey and the story behind the paper ‘2Detect – A large 2D expandable, trainable, experimental Computed Tomography data collection for machine learning’, that was recently published in Nature Scientific Data.

Publication date
2 Oct 2023
Maximilian Kiss

About the blogpost

“Usually, people only share their success stories, shine light on the nice and easy things, and do not mention the failure and challenges they have met on the way”, Maximilian Kiss explains. When he was asked by Springer Nature to write a ‘Behind the paper’, he wrote about the entire trajectory of the research, from conception to publication. It includes the highs and lows and describes the challenges Maximilian and his colleagues have faced on the way.

Full text of the blog post:

This versatile, open 2D -CT dataset is suitable for developing ML techniques for a broad range of image processing tasks such as such as low-dose reconstruction, limited or sparse angular sampling, beam-hardening artifact reduction, super-resolution, region-of-interest tomography or segmentation.

In many fields the application of artificial intelligence is an important topic nowadays. The computational imaging community also aims to utilize machine learning techniques for tomographic image reconstruction. This includes the PhD project of Maximilian Kiss, the first author of the manuscript mentioned above and writer of this blog post, which focuses on using deep learning methods for tomographic image reconstruction and segmentation. For the development and training of deep learning algorithms it is highly important to have a sufficient amount of realistic experimental data. There is, however, a lack of large 2D experimental data collections in the field of X-ray computed tomography which limits the development and evaluation of deep learning algorithms. The few datasets that are available are commonly limited, because they are developed for one specific application and therefore could not enable the research of the author.

Overview of the scope of the 2DeteCT dataset.
Fig. 1: Overview of the scope of the 2DeteCT dataset.

This was the origin and motivation for our project “2Detect – A large 2D expandable, trainable, experimental Computed Tomography data collection for machine learning”, which aimed to acquire a large 2D computed tomography dataset for a broad range of application areas, such as denoising, sparse- and limited-angle scanning, beam-hardening reduction, super-resolution, region-of-interest tomography or segmentation. However, there are several requirements involved in acquiring such a large 2D CT dataset. Firstly, research groups must have easy access to a scanning facility, which can be used for a time-consuming data collection process on a large scale. Secondly, the employed scanner must have the capability to adjust the acquisition geometry and acquisition parameters to ensure that the dataset collected is suitable for a wide range of machine learning applications. Thirdly, the image characteristics should closely resemble those encountered in medical CT, as medical imaging is a crucial application area for X-ray CT. Lastly, it is essential to minimize manual intervention during the acquisition process in order to obtain a substantial number of CT reconstruction slices. This necessitates automating the acquisition process as much as possible.

Since our “Computational Imaging” research group at Centrum Wiskunde & Informatica (CWI) could meet all these requirements, we took on the challenge to create such a large 2D Computed Tomography dataset. For this, it was especially important to understand the needs of the community and the prerequisites on the data we wanted to collect. Furthermore, we needed to acquire an in-depth knowledge about all the capabilities of the FleX-ray scanner, a highly flexible, programmable and custom-built X-ray CT scanner located at CWI. This was integral to the selection and testing of the various acquisition parameters and scanning objects for achieving versatile application areas for the dataset, such as denoising, sparse- and limited-angle scanning, beam-hardening reduction, super-resolution, region-of-interest tomography or segmentation.

Objectives

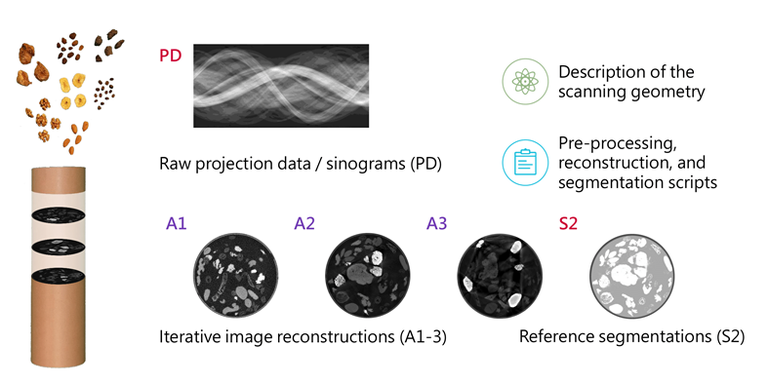
The objectives were to acquire at least a noisy, a beam-hardening artifact-inflicted and a “clean” scan as a ground truth and starting point for constructing a high-confidence segmentation, since data for sparse- and limited-angle, super-resolution and region-of-interest tomography can be generated from scans with a large amount of angle projections and high resolution. Therefore, data had to be acquired in three different acquisition modes: Mode 1: the noisy, low-dose acquisition; mode 2: the clean, high-dose acquisition; and mode 3: the beam hardening artifact-inflicted acquisition. Choosing suitable acquisition parameters for these different modes was a difficult process and required a lot of test scans.

The pressure on making “the right choices” for such a large-scale project was quite big, because we wanted to be certain that these choices will actually enable the versatile application areas and that every consideration will work in the end. Therefore, the first nine months after the initial idea of the dataset were used for meticulous testing of potential sample objects, potential acquisition parameters and potential scanning protocols. This included finding suitable sample containers by browsing in hardware and craft stores and testing their properties in the CT scanner. It also involved upgrading the capabilities of the FleX-ray scanners since the device did not contain the possibility to filter the X-ray beam used for acquiring the CT scans. The author had to design and 3D-print an extension to the FleX-ray scanner that would enable the placement of metal filter sheets of varying materials and thicknesses.

Visiting a garden centre

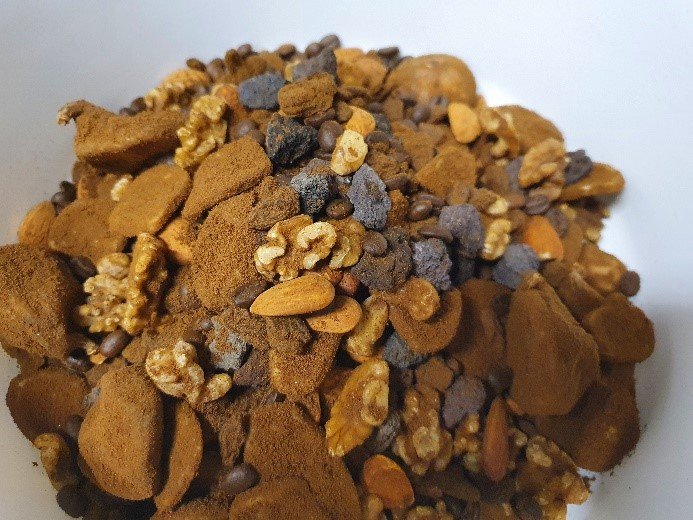
Furthermore, we searched for a suitable mix of samples with high natural variability in shape and density, resembling the image characteristics found in abdominal CT scans. This encompassed buying various food items from the supermarket and scanning all kinds of fruits, vegetables, and nuts to evaluate their appearance in CT scans. The final mix consisted of almonds, dried banana chips, coffee beans, dried figs, raisins, and walnuts immersed in cereal-based coffee powder as a filler material (cf. Fig. 2). Unfortunately, the image reconstructions of this sample mix showed no visual differences between the different acquisition modes selected earlier.

The final sample mix consisting of almonds, dried banana chips, coffee beans, dried figs, lava stones, raisins, and walnuts immersed in cereal-based coffee powder as a filler material.
Fig. 2: The final sample mix consisting of almonds, dried banana chips, coffee beans, dried figs, lava stones, raisins, and walnuts immersed in cereal-based coffee powder as a filler material.

It was not until a walk around the research institute on a path of seashells, stones, and gravel, when the idea came to mind that including a high-density sample such as stones could cause beam hardening artifacts in the CT scans and elevate the usability of the dataset. We visited a garden centre to collect a large variety of stone samples such as different types of basalt, granite, limestone, lava stone, marble, quartz, and slate and tested all of them in the final sample mix. It showed that the lava stones are the most promising sample (cf. Fig. 3).

Variety of stone samples at the garden centre such as different types of basalt, granite, limestone, lava stone, marble, quartz, and slate.
Fig. 3: Variety of stone samples at the garden centre such as different types of basalt, granite, limestone, lava stone, marble, quartz, and slate.

For the final acquisition protocol there still remained a large challenge, because the extension to the FleX-ray scanner designed for using beam filters was a static setup. Without human intervention one could not scan with and without beam filters to achieve both beam-hardening artifact-inflicted and “clean” images from the same sample. For this we developed a new kind of setup within our scanner cabinet and built a “filter sail” which was placed between the X-ray tube and the sample tube to be able to scan multiple vertical slices with a filter. The source, rotation stage and detector can be moved at the same time, which meant it was possible to get this filter sail into the beam axis without human interaction during the process (cf. red arrows in Fig. 4).

FleX-ray Lab: the computed tomography set-up used for the data acquisition. (1) Cone-beam X-ray source; (2) Thoraeus filter sail [Sn 0.1mm, Cu 0.2mm, Al 0.5mm]; (3) Rotation stage; (4) Sample tube; (5) Flat panel detector. The objects 1, 3, 4, and 5 move from their red transparent front position to the mid position for the acquisitions of mode 3. In both positions 3,601 projection images per slice are taken while the object rotates 360 degrees.
Fig. 4: FleX-ray Lab: the computed tomography set-up used for the data acquisition. (1) Cone-beam X-ray source; (2) Thoraeus filter sail [Sn 0.1mm, Cu 0.2mm, Al 0.5mm]; (3) Rotation stage; (4) Sample tube; (5) Flat panel detector. The objects 1, 3, 4, and 5 move from their red transparent front position to the mid position for the acquisitions of mode 3. In both positions 3,601 projection images per slice are taken while the object rotates 360 degrees.

But even after finding the final sample mix and after designing a feasible experimental setup as well as a suitable scanning protocol there were still challenges left that we as experimental researchers could run into. In the remainder of the blog post we want to share five smaller and bigger challenges that we have experienced during the dataset acquisition:

  1. Running hot – X-rays melting scanning samples.One of the earliest challenges we ran into was when we removed our sample tube containing the cereal-based coffee powder and lava-stones from the scanner after an 8,5-hour long scanning session and found the inside to contain warm, gluey, melted blocks. After some in-depth reflection we figured out that the presence of a lot of high-density materials (the lava stones) stored a lot of energy in form of heat in the sample tube which could not dissipate as well as with a more diverse sample mix and that this caused the cereal-based coffee powder to caramelize.
  2. Reading speeds – How different storage types affect file transfer.Another challenge was to transfer the large number of small files efficiently from the scanning computer onto a workstation with which the files could be processed later. The reading speeds of the HDD disk were much too small for an efficient file transfer and caused a huge backlog because it halted data acquisition for the duration of the file transfer. After some experiments we found a solution in restarting the scanner PC before every acquisition. With that the files written onto the disk would still be stored in the RAM of the PC as well which enabled a quicker reading speed and therefore also a more efficient file transfer.
  3. Breaking equipment – No detector, no 2DeteCT.Roughly half-way through the acquisition of the dataset we experienced another set-back when the detector of the FleX-ray scanner broke down. At that time, it was unknown if it could be fixed and for how long the scanner would be inactive. Furthermore, we needed to test whether the measurements with the new detector were systemically different from the first half of the data acquisition. Luckily, the company which built the scanner could fix the problem and recalibrate the system within less than two weeks such that the data acquisition could go on quickly.
  4. Exceeding disk space – Hardware limits when dealing with Big Data.Dealing with such a large amount of data also creates practical problems, for example with data storage. Close to the end of the data acquisition we actually ran into the hardware limit of the SSD in our workstation given by a maximum of ca. 55.9 million files to be stored on it. Therefore, we also had to utilize the HDD in our workstation for the initial data storage. This showed why supplying the 1x1,912 line projections directly would be very unfeasible for the users of the 2DeteCT dataset. Accordingly, instead of uploading every single measurement separately we combined the line projections to 3,601x1,912 sinograms.
  5. Regulations and data efficiency – How to structure a dataset for a diverse user group.As a last step after the acquisition, we had to think about the desired structure of the dataset. After some practical considerations we decided to split the dataset into 12 separate repositories because of two reasons: regulations and data efficiency. First, the volume and size limitations of Zenodo state that the “total files size limit per record is 50GB. Higher quotas can be requested and granted on a case-by-case basis.” Second, users of the dataset shall not be forced to download the complete dataset with a size of over 300GB. Oftentimes researchers might want to test or develop algorithms on a smaller part of a dataset, in the scope of e.g. 1,000 slices before considering downloading a full dataset. Furthermore, we did not want to impose the necessity on researchers to automatically download the reference reconstructions and segmentations if they do not need them. Also, the out-of-distribution (OOD) slices are again two separate uploads because some researchers might not be interested in them for their particular work. With this approach of data efficiency and bound by the regulations of Zenodo we chose to split raw projection data from the reference reconstructions and segmentations for chunks of 1,000 slices each (750 OOD).

To conclude

The 2DeteCT dataset was an enormous project with various challenges. Apart from the nine months of meticulous testing, the data acquisition alone took roughly five months of almost continuous scanning where we often initialized scans both early in the morning and late at night. Receiving a lot of positive feedback from the computational imaging community on the way when presenting the idea of the dataset, its initial conceptualization, and the first results definitely helped us to keep going. Finally, seeing this hard work now being published in a prestigious journal such as Nature Scientific Data is incredibly rewarding.

We hope this “Behind the Paper” blog post has given other researchers an insight in the challenges of the experimental research process and has shown that producing Scientific Data requires creativity, perseverance, and resilience.

Maximilian Kiss
Maximilian Kiss