Researchers from Centrum Wiskunde & Informatica (CWI), the national research institute for mathematics and computer science in the Netherlands, discovered how large fluctuations in solar and wind energy, combined with the physical network dynamics of electricity, can cause failures in power grids. The mathematical framework developed by the researchers helps to predict the appearance of potential power line failures. The article was published in Physical Review Letters on 21 June 2018.
Power grids are operated based on cost-effective principles and therefore heavily congested. Combined with extreme weather scenarios, this can lead to lines in the grid to fail or shut down. A failure causes a global redistribution of power flows, increasing stress on the remaining lines, possibly triggering further outages and even system-wide blackouts. It is therefore of major societal importance to ensure that the transformation to a sustainable society does not lead to a degradation in the quality of electricity supply.
Predicting the weakest links
CWI researchers Tommaso Nesti, Alessandro Zocca and Bert Zwart have investigated how the early stage of such a process can be influenced by solar and wind power output. Using an analogy with statistical physics, they view a large electricity grid with many renewable inputs as a particle system. This allows identifying which lines in the grid are most vulnerable to fluctuations in weather patterns as well as the most likely way failures propagate in the network.
Line failures can be caused by many small fluctuations that occur over a large geographic region. The number of subsequent failures can be significantly higher than predicted by previous models, where weather patterns were not taken into account.
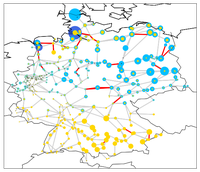
These insights, which have been validated with data from the German transmission grid, provide a new framework to detect vulnerabilities in power grids and will help to better handle fluctuations in renewables, preventing power failures as a result.

Image caption
Top 5% most vulnerable lines in the German transmission network, depicted in red. Blue and yellow nodes represent wind and solar parks, respectively, and the size of a node is proportional to the amount of renewable generation produced at that location. The snapshot corresponds to January 1st 2011, 11 am.
More information
- Article Emergent failures and cascades in power grids: A statistical physics perspective and synopsis in Physical Review Letters
- Link to article in CWI repository (full text)
- CWI Stochastics group (video)
- Tommaso Nesti (CWI)
- Alessandro Zocca (Former CWI, now Caltech)
- Bert Zwart (Group leader CWI Stochastics group, Vici laureate)
